Micron M500DC (480GB & 800GB) Review
by Kristian Vättö on April 22, 2014 2:35 PM EST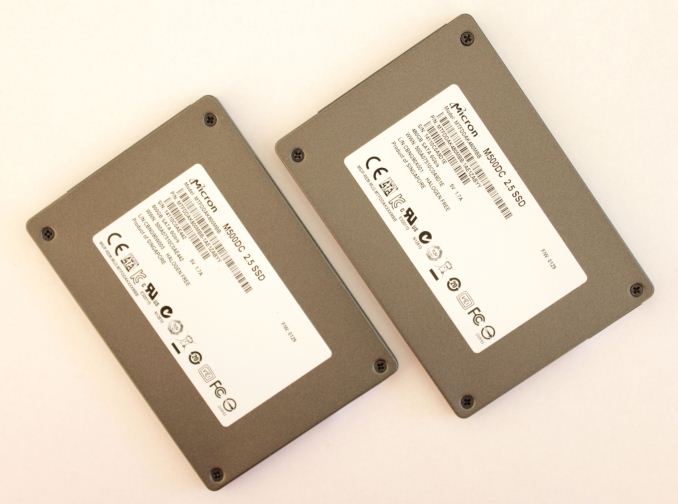
While the client SSD space has become rather uninteresting lately, the same cannot be said of the enterprise segment. The problem in the client market is that most of the modern SSDs are already fast enough for the vast majority and hence price has become the key, if not the only, factor when buying an SSD. There is a higher-end market for enthusiasts and professionals where features and performance are more important, but the mainstream market is constantly taking a larger and larger share of that.
The enterprise market, on the other hand, is totally different. Unlike in the client world, there is no general "Facebook-email-Office" workload that can easily be traced and the drives can be optimized for that. Another point is that enterprises, especially larger ones, are usually well aware of their IO workloads, but the workloads are nearly always unique in one way or the other. Hence the enterprise SSD market is heavily segmented as one drive doesn't usually fit all workloads: one workload may require a drive that does 100K IOPS in 4KB random write consistently with endurance of dozens of petabytes, while another workload may be fine with a drive that provides enough 4KB random read performance to be able to replace several hard drives. Case in point, this is what Micron's enterprise SSD lineup looks like:
| Comparison of Micron's Enterprise SSDs | |||||
| M500DC | P400m | P400e | P320h | P420m | |
| Form Factor | 2.5" SATA | 1.8" ; .2.5" SATA, mSATA | 2.5" PCIe, HHHL PCIe | ||
| Capacities (GB) | 120, 240, 480, 800 | 100, 200, 400 | 50, 100, 200, 400 | 175, 350, 700 | 350, 700, 1400 |
| Controller | Marvell 9187 | Marvell 9174 | IDT 32-channel PCIe 2.0 x8 | ||
| NAND | 20nm MLC | 25nm MLC | 25nm MLC | 34nm SLC | 25nm MLC |
| Sequential Read (MB/s) | 425 | 380 | 440 / 430 | 3200 | 3300 |
| Sequential Write (MB/s) | 200 / 330 / 375 | 200 / 310 | 100 / 160 / 240 | 1900 | 600 / 630 |
| 4KB Random Read (IOPS) | 63K / 65K | 52K / 54K / 60K | 59K / 44K / 47K | 785K | 750K |
| 4KB Random Write (IOPS) | 23K / 33K / 35K / 24K | 21K / 26K | 7.3K / 8.9K / 9.5K / 11.3K | 205K | 50K / 95K |
| Endurance (PB) | 0.5 / 1.0 / 1.9 | 1.75 / 3.5 / 7.0 | 0.0875 / 0.175 | 25 / 50 |
5 / 10 |
In order to fit the table on this page, I even had to leave out a few models, specifically the P300, P410m, and P322h. With today's release of the M500DC, Micron has a total of eight different active SSDs in its enterprise portfolio while its client portfolio only has two.
Micron's enterprise lineup has always been two-headed: there are entry to mid-level SATA/SAS products, which are followed by the high-end PCIe drives. The M500DC represents Micron's new entry-level SATA drive and as the naming suggests, it's derived from the client M500. The M500 and M500DC share the same controller (Marvell 9187) and NAND (128Gbit 20nm MLC) but otherwise the M500DC has been designed from ground up to fit the enterprise requirements.
| Micron M500DC Specifications (Full, Steady-State) | ||||
| Capacity | 120GB | 240GB | 480GB | 800GB |
| Controller | Marvell 88SS9187 | |||
| NAND | Micron 128Gbit 20nm MLC | |||
| DRAM | 256MB | 512MB | 1GB | 1GB |
| Sequential Read | 425MB/s | 425MB/s | 425MB/s | 425MB/s |
| Sequential Write | 200MB/s | 330MB/s | 375MB/s | 375MB/s |
| 4KB Random Read | 63K IOPS | 63K IOPS | 63K IOPS | 65K IOPS |
| 4KB Random Write | 23K IOPS | 33K IOPS | 35K IOPS | 24K IOPS |
| Endurance (TBW) | 0.5PB | 1.0PB | 1.9PB | 1.9PB |
The M500DC is aimed at data centers that require affordable solid-state storage, such content streaming, cloud storage, and big data analytics. These are typically hyperscale enterprises and due to their exponentially growing storage needs, the storage has to be relatively cheap or otherwise the company may not have the capital to keep up with the growth. In addition, most of these data centers are more read heavy (think about Netflix for instance) and hence there is no need for high-end PCIe drives with endurance in the order of dozens of petabytes.
In terms of NAND the M500DC features the same 128Gbit 20nm MLC NAND as its client counterpart. This isn't even a high-endurance or enterprise specific part -- it's the same 3,000 P/E cycle part you find inside the normal M500. Micron did say that the parts going inside the M500DC are more carefully picked to meet the requirements but at a high-level we are dealing with consumer-grade MLC (or cMLC).
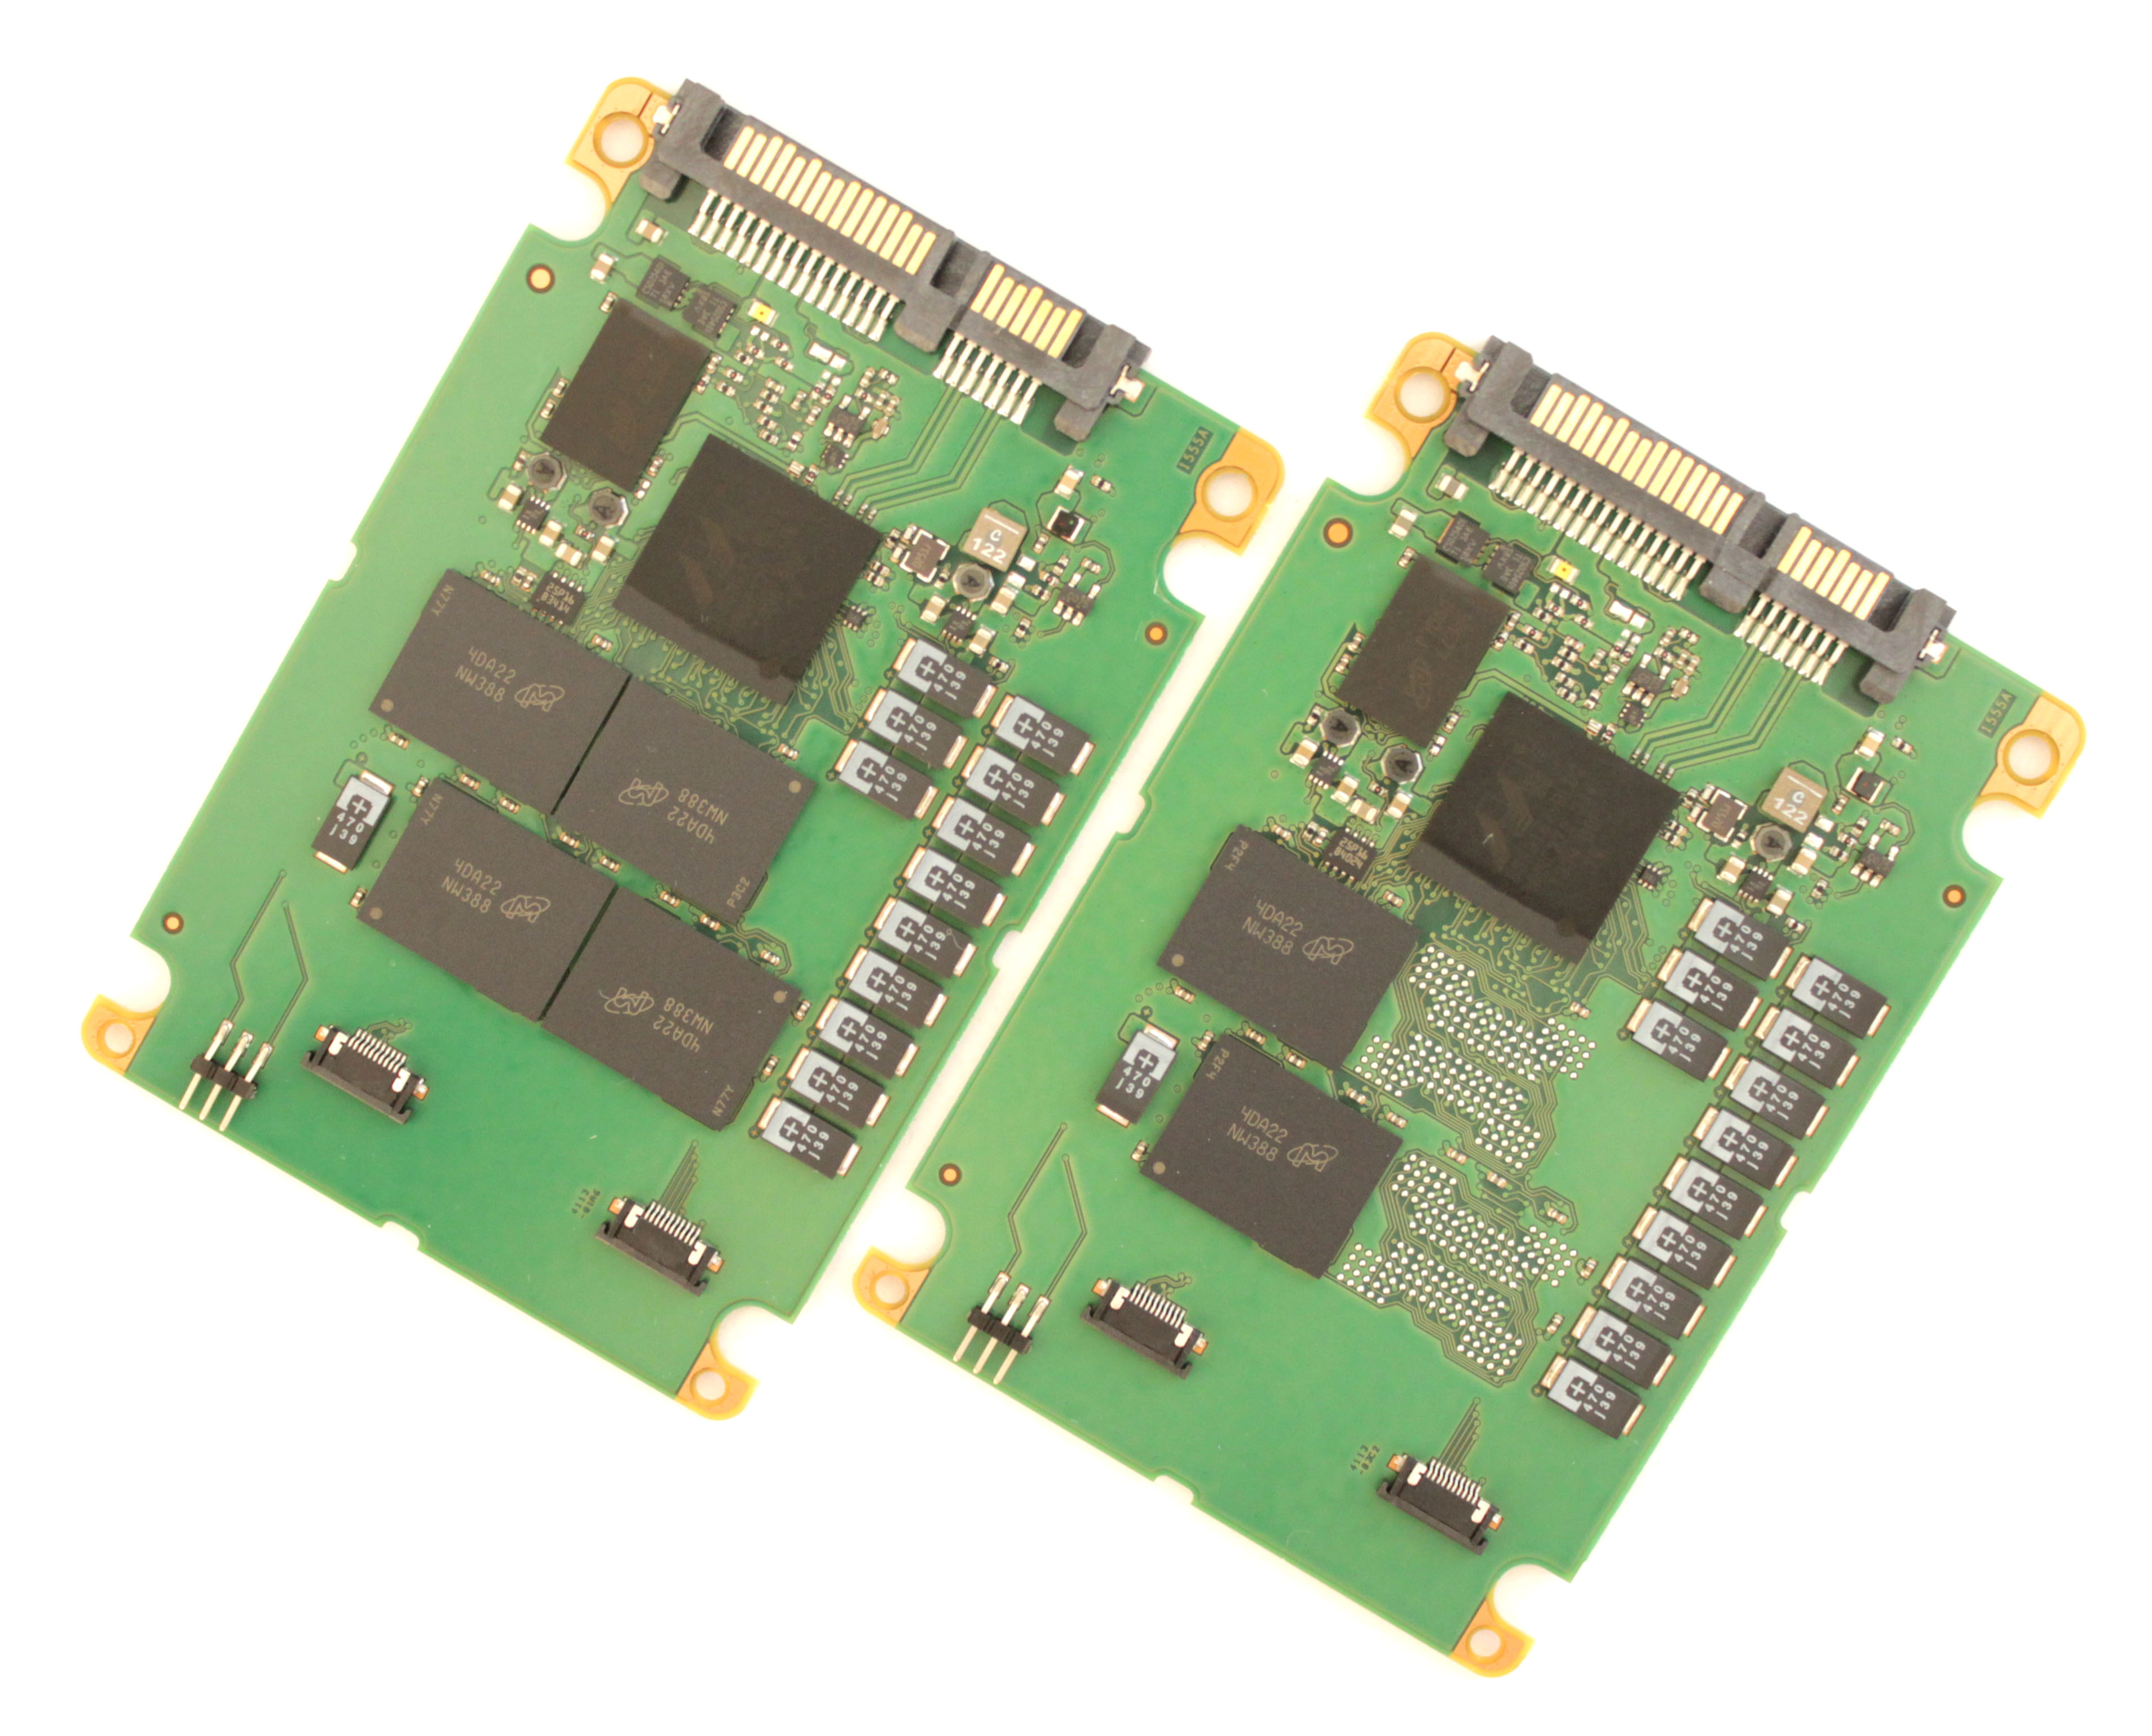
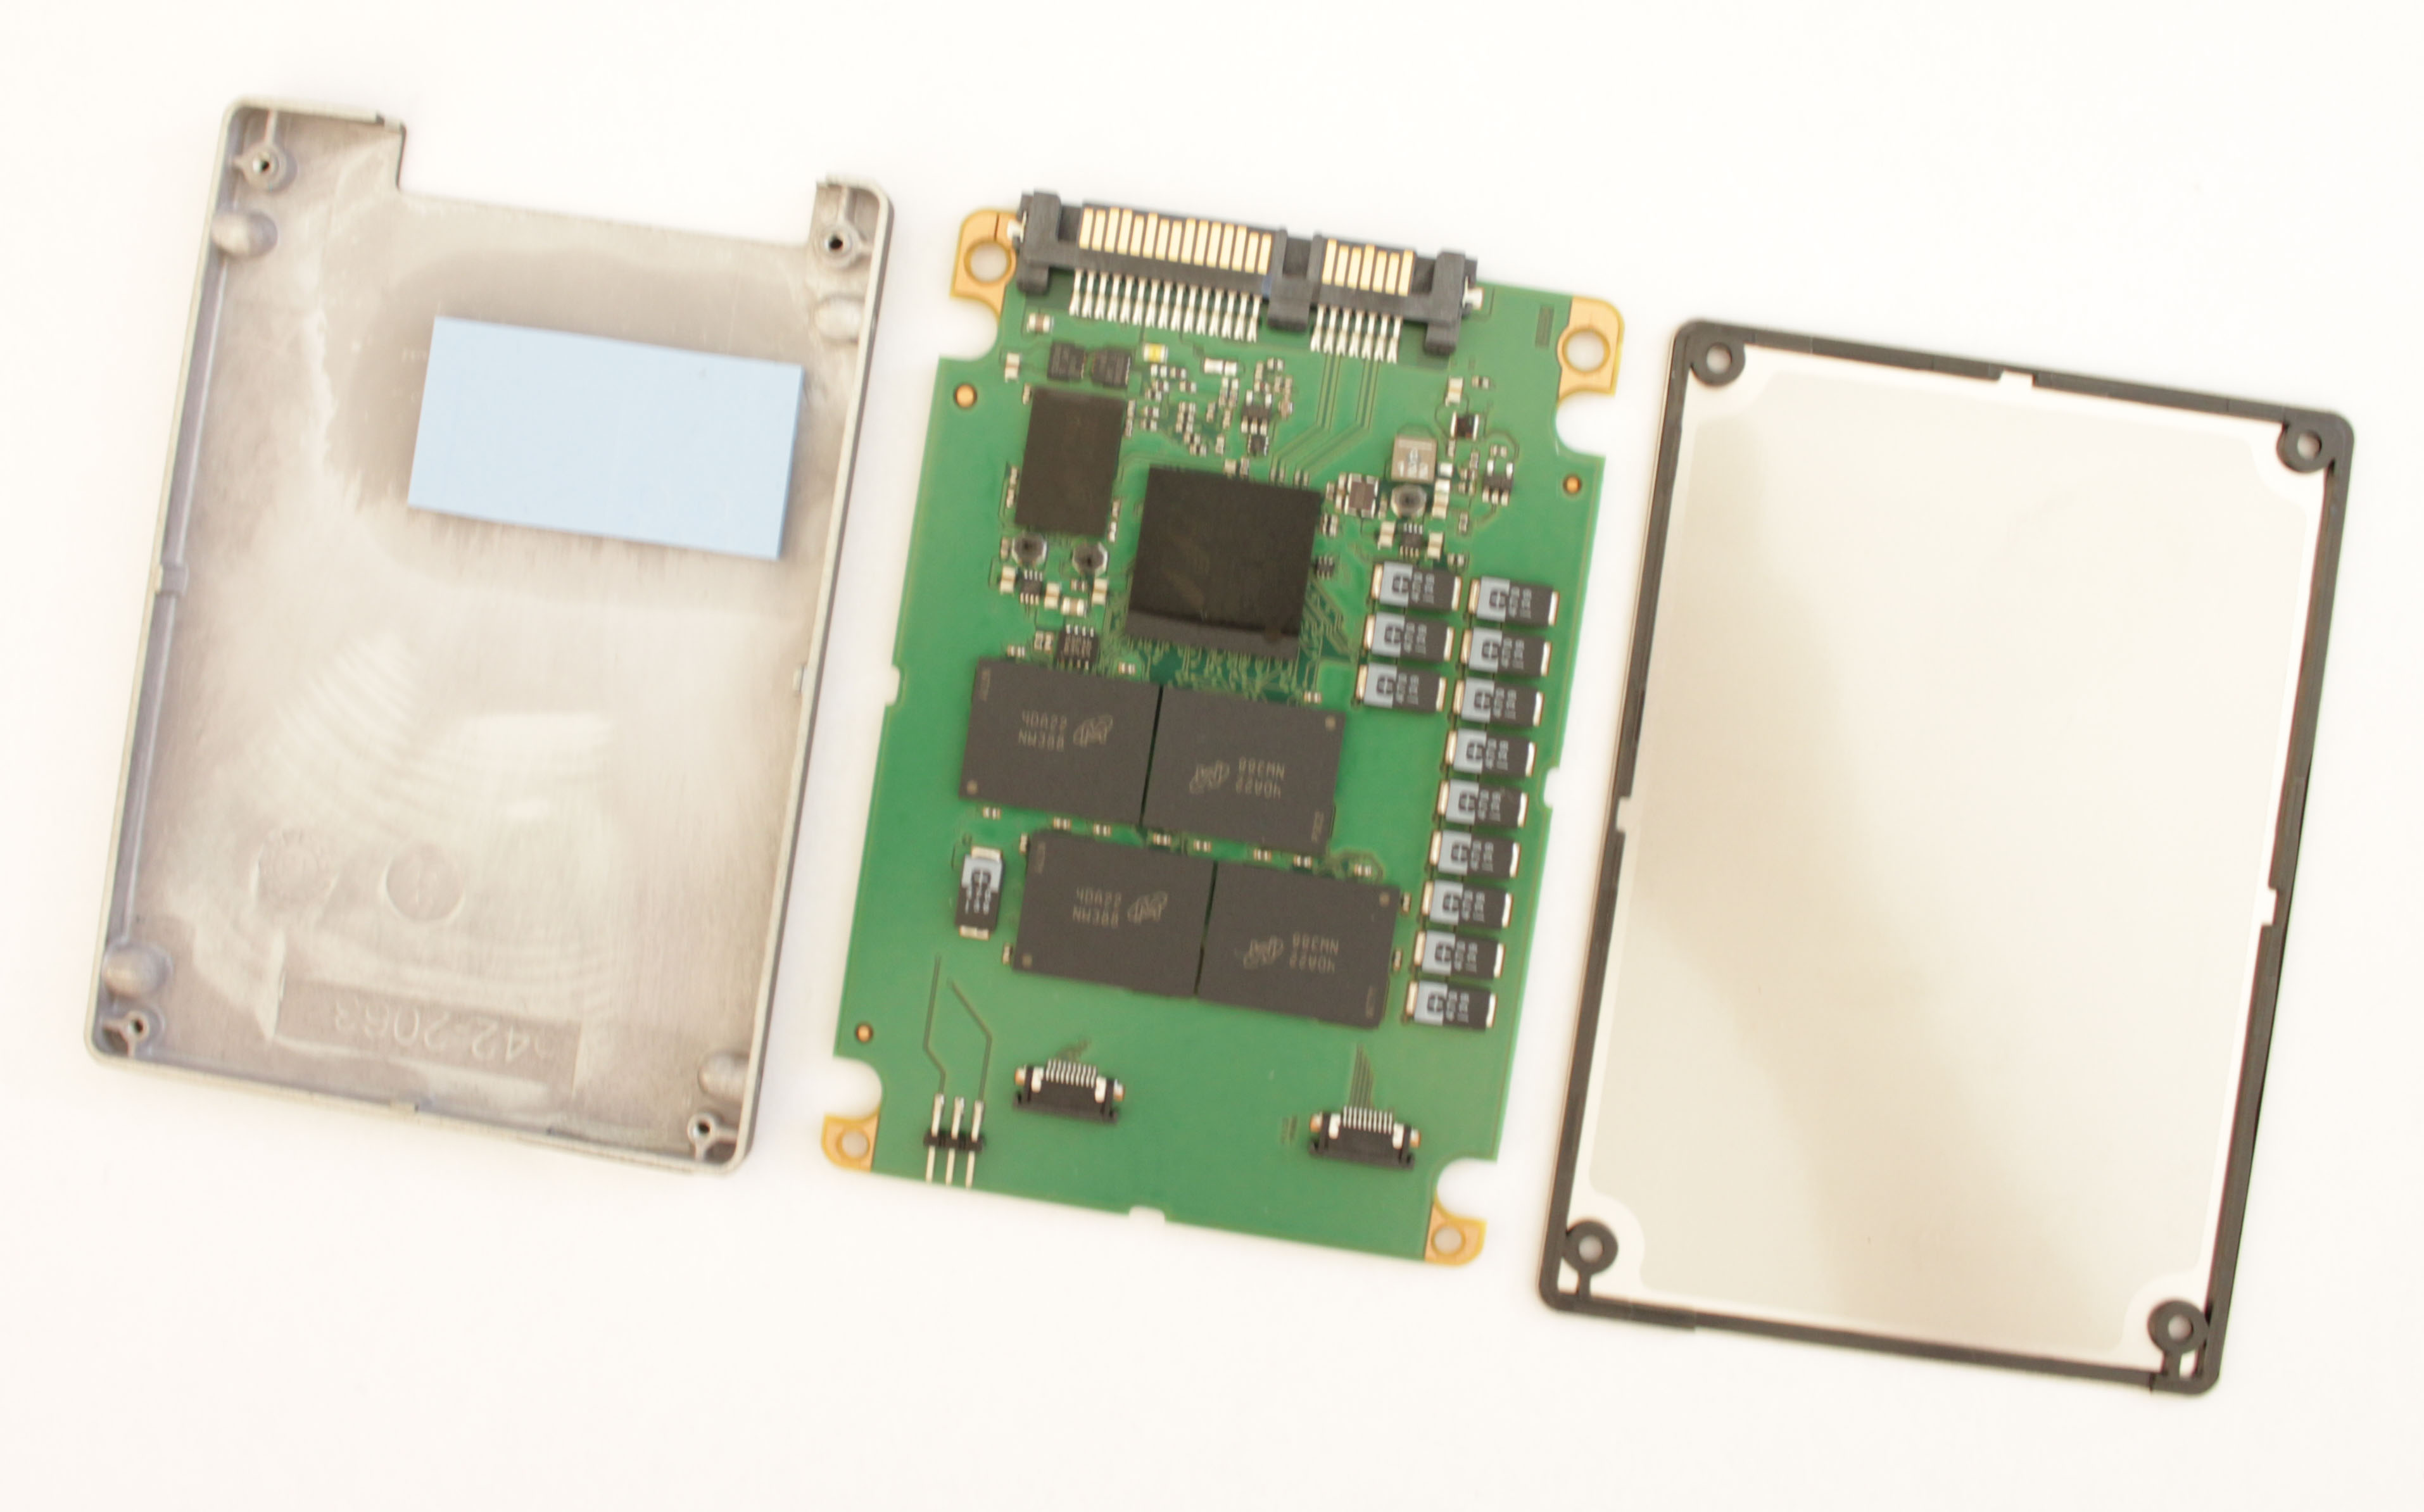
To get away with cMLC in the enterprise space, Micron sets aside an enormous portion of the NAND for over-provisioning. The 480GB model features a total of six NAND packages, each consisting of eight 128Gbit dies for a total NAND capacity of 768GiB. In other words, only 58% of the NAND ends up being user-accessible. Of course not all of that is over-provisioning as Micron's NAND redundancy technology, RAIN, dedicates a portion of the NAND for parity data, but the M500DC still has more over-provisioning than a standard enterprise drive. The only exception is the 800GB model which has 1024GiB of NAND onboard with 73% of that being accessible by the user.
| User Capacity | 120GB | 240GB | 480GB | 800GB |
| Total NAND Capacity | 192GiB | 384GiB | 768GiB | 1024GiB |
| RAIN Stripe Ratio | 11:1 | 11:1 | 11:1 | 15:1 |
| Effective Over-Provisioning | 33.5% | 33.5% | 33.5% | 21.0% |
A quick explanation for the numbers above. To calculate the effective over-provisioning, the space taken by RAIN must be taken into account first because RAIN operates at the page/block/die level (i.e. parity is not only generated for the user data but all data in the drive). A stripe ratio of 11:1 basically means that every twelfth bit is a parity bit and thus there are eleven data bits in every twelve bits. In other words, out of 192GiB of raw NAND only 176GiB is usable by the controller to store data. Out of that 120GB (~112GiB) is accessible by the user, which leaves 64GiB for over-provisioning. Divide that by the total NAND capacity (192GiB) and you should get the same 33.5% figure for effective over-provisioning as I did.
| Test Setup | |
| CPU | Intel Core i7-4770K at 3.5GHz (Turbo & EIST enabled, C-states disabled) |
| Motherboard | ASUS Z87 Deluxe (BIOS 1707) |
| Chipset | Intel Z87 |
| Chipset Drivers | 9.4.0.1026 |
| Storage Drivers | Intel RST 12.9.0.1001 |
| Memory | Corsair Vengeance DDR3-1866 2x8GB (9-10-9-27 2T) |
| Graphics | Intel HD Graphics 4600 |
| Graphics Drivers | 15.33.8.64.3345 |
| Power Supply | Corsair RM750 |
| OS | Windows 7 Ultimate 64-bit |
Before we get into the actual tests, we would like to thank the following companies for helping us with our 2014 SSD testbed.
- Thanks to Intel for the Core i7-4770K CPU
- Thanks to ASUS for the Z87 Deluxe motherboard
- Thanks to Corsair for the Vengeance 16GB DDR3-1866 DRAM kit, RM750 power supply, Hydro H60 CPU cooler and Carbide 330R case


37 Comments
View All Comments
Solid State Brain - Tuesday, April 22, 2014 - link
Enterprise SSDs usually have their endurance rated at 3 months of residual data retention capability, vs 1 year for consumer models. Since data retention time decreases with NAND wear, this allows manufacturers to claim almost "for free" a higher endurance than what the P/E limit for consumer NAND memory would suggest, even though it might be the exact same memory (but different requirements).Most likely, the rated endurance for these drives is at a much higher number of P/E cycles than 3000.
Kristian Vättö - Tuesday, April 22, 2014 - link
"Most likely, the rated endurance for these drives is at a much higher number of P/E cycles than 3000."I don't think that is necessarily the case. If you look at my calculations on the "Endurance Ratings" page, the combined WLF and WAF is already only 1.24x when using the raw NAND capacity to calculate the endurance at 3,000 P/E cycles. 1.24x is excellent, so I find it hard to believe that the NAND would be rated at higher than 3,000 cycles as the combined WLF and WAF would essentially be about 1.00 in that case (which is basically impossible without compression). Also, Micron specifically said that this is a 3,000 P/E cycle part.
Solid State Brain - Tuesday, April 22, 2014 - link
As the endurance rating for enterprise drives is usually intended for a typical steady random workload (and no trim to help), the write amplification factor should be higher than the rather low value you used for your calculation. You can see that endurance figures (not just in this case, but most other other enterprise drives as well) start make more sense when actual P/E cycles for that usage/application are higher than their consumer counterparts.Here's a prominent example. You could try the same calculation here. In this specification sheet for 2013 Samsung enterprise drives, which includes a model with TLC NAND, it's dead obvious that the rated P/E cycles limit of consumer drives (unofficially, rated 1000 cycles) doesn't apply for them, even though for the low end models they're most certainly using the same memory. You never really see a fixed P/E cycles limit for enterprise drives as in the end is the TBW figure that counts and the shorter data retention requirement for them helps boosting that even though there might actually not be any hardware difference at all.
http://www.samsung.com/global/business/semiconduct...
apudapus - Tuesday, April 22, 2014 - link
The specs you linked definitely show 1000 P/E cycles for all the NAND on all the drives, TLC and MLC. I used this formula: Total Bytes Written Allowed = NAND P/E cycles * Total Bytes Written per DayEnterprise drives have lower data retention requirements because in the enterprise space, drives will be read and written to more frequently and will not be powered off for extended periods of time. Consumer drives on the other hand can have a lots of down time.
Solid State Brain - Tuesday, April 22, 2014 - link
PM843, TLC NAND rated 1000 P/E cycles on the consumer version. Let's take the 120GB model as an example.Endurance with 100% sequential workloads: 207 TB
1000 P/E (NAND life @ 1 year of data retention, on the consumer version) * 128 GiB (physical NAND capacity) = 128000 GB = 125 TiB. This drive doesn't make use of data compression. With sequential workloads the best case write amplification would therefore be 1.0x. To reach the claimed 207 TiB of terabytes written of endurance, the NAND memory on this drive would need at the very least to endure 1000/125*207 = 1656 P/E cycles, again assuming the best case write amplification factor. One can expect this to be at least around 1.15-1.20x under real world scenarios, which would bring this figure to about 1900-2000 P/E cycles.
SM843, the enterprise version of the 840 Pro with 3000 P/E cycles MLC NAND. Again, let's take the 120GB version for reference.
Stated endurance with 100% sequential workloads: 1 PB
128 GiB physical capacity * 3000 P/E cycles = 375 TiB
Actual P/E cycles needed for 1 PB at 1.0x write amplification: 3000 * 1024/375 = 8192
Kristian Vättö - Wednesday, April 23, 2014 - link
Like I said, ultimately it's impossible to figure out where exactly the endurance is coming from. It's likely that the NAND could be rated higher thanks to the looser retention requirements (3 months vs 1 year) in the enterprise space but then again, figuring out the exact P/E cycle count isn't easy because we don't know the write amplification.Solid State Brain - Wednesday, April 23, 2014 - link
If you have spare time and still have the drives you could try applying a standard sustained 4kB random load for an extended period of time to figure out what the write amplification for these drives with that usage is. Marvell-based SSDs usually provide, in a way or another, both NAND writes and Host writes among their monitoring attributes, and with these data it's pretty straightforward to calculate it. Given the large OP area, I predict it will end up being somewhere around 2.5x.Kristian Vättö - Wednesday, April 23, 2014 - link
I still have the drives but there are other products in the review queue. I'll see what I can do -- the process is rather simple as you outlined I've done some similar testing in the past too.Kristian Vättö - Wednesday, April 23, 2014 - link
*and I've done similar testing in the past too.(Yes, we need an edit button)
apudapus - Wednesday, April 23, 2014 - link
OIC. My best guess is that the voltage thresholding (their ARM/OR) extends the life of the NAND.